
Building Materials Retail Analytics: The Metrics That Actually Drive Revenue
Most building materials dealers are not short on data. They are short on visibility into the right data at the right time. Category penetration by account, buying frequency changes, and wallet share against permit activity are the metrics that tell you what to do next. Getting there requires clean category mapping, automated ERP data flow, and dashboards configured for the decisions each role is actually making.


A sales manager ends the quarter with revenue down 8%. She knows the number. What she cannot tell you is which accounts drove it, whether it was category-level softness or account drift, or which reps have the most at-risk revenue right now. All of that data exists in their ERP. Getting to it requires someone to pull reports and build a spreadsheet, and by then the quarter is already over.
This is the analytics problem most LBM dealers actually have. Not a data shortage. A visibility problem.
What most yards are tracking, and why it is not enough
Total sales, transaction count, gross margin by product line. These are the metrics that show up in most LBM dealer reporting, and they share the same limitation: they tell you where you ended up, not what to do next. By the time a revenue decline appears in a monthly or quarterly report, the accounts behind it have been sliding for months.
The metrics that actually change behavior are different. They surface a specific account or opportunity that a rep can act on today.
Category penetration by account
A contractor buying framing and sheathing regularly but never quoted on roofing or windows is a cross-sell opportunity sitting in your ERP right now. Most yards miss this for mid-tier accounts because no one is systematically looking at what each contractor does and does not buy. Rep memory covers the top 20. Everyone else is a gap.
Buying frequency changes
A contractor who ordered every two weeks and now orders monthly has not left yet. But the drift has started. Seeing that pattern while the relationship is still warm is what makes recovery realistic. Seeing it in a year-end review is not. The accounts worth calling are the ones showing early frequency changes, not the ones already gone.
Wallet share against permit activity
A contractor doing 10 active jobs in your market and buying from you on three of them looks like a solid account from the ERP alone. Matched against their permit activity, the same account looks like a significant gap. That is a different conversation with the rep, and you cannot have it without layering permit data on top of transaction history.
Why getting there is harder than it sounds
LBM ERPs are built to process transactions, not surface sales intelligence. Getting category penetration by account requires clean category mapping across your full product structure, including special order items that often fall outside standard hierarchies. Tracking frequency changes across the full book requires a dashboard that updates automatically, not a manual pull someone does when they have time. And wallet share requires matching ERP customer records to permit contractor names, which is a fuzzy matching problem that cannot be solved in a spreadsheet.
What SalesJack surfaces automatically
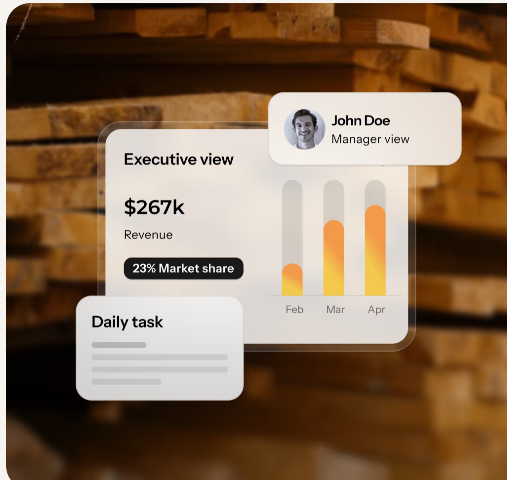
SalesJack's Analytics pulls transaction history and permit data into role-specific dashboards configured for building materials sales. Category mapping is handled during implementation. Buying frequency changes surface automatically across the full book so managers can see which accounts need attention without pulling a report. And the market share view matches ERP spend to permit activity using AI, showing what percentage of each contractor's estimated total material spend is flowing through your yard, with the ability to drill down to specific addresses you are not winning.
Dashboards are configured by role. Reps see their book: category gaps, frequency changes, open quotes. Managers see rep-level activity and cross-sell conversion across the team. Owners and GMs see retention trends and wallet share movement by territory. Evanston Lumber grew new customer acquisition significantly and PARR Lumber generated $500k in new revenue in six months, both detailed in the case studies.
See your data in dashboards built for your yard
SalesJack integrates with Epicor, ECI, DMSI, Genetiq, and Ponderosa and configures role-specific dashboards during a 4 to 6 week implementation that includes ERP integration, category mapping, and on-site training. More on rollout at Support and Training.
Book a demo to see how the dashboards work against your specific ERP and account structure, or use the Contact page to discuss which metrics would drive the most value for your team.
Bottom line
Most building materials dealers are not short on data. They are short on visibility into the right data at the right time. Category penetration by account, buying frequency changes, and wallet share against permit activity are the metrics that tell you what to do next. Getting there requires clean category mapping, automated ERP data flow, and dashboards configured for the decisions each role is actually making.
For more on how building materials dealers use data to grow revenue, check out the SalesJack blog.
.svg)


%20(1).png)
.png)
.svg)
.svg)